
 Español
The report
The report is a reading of what people posted, not a poll. Every card has an i that explains what it shows and, when there is one, the AI’s reason.
The header
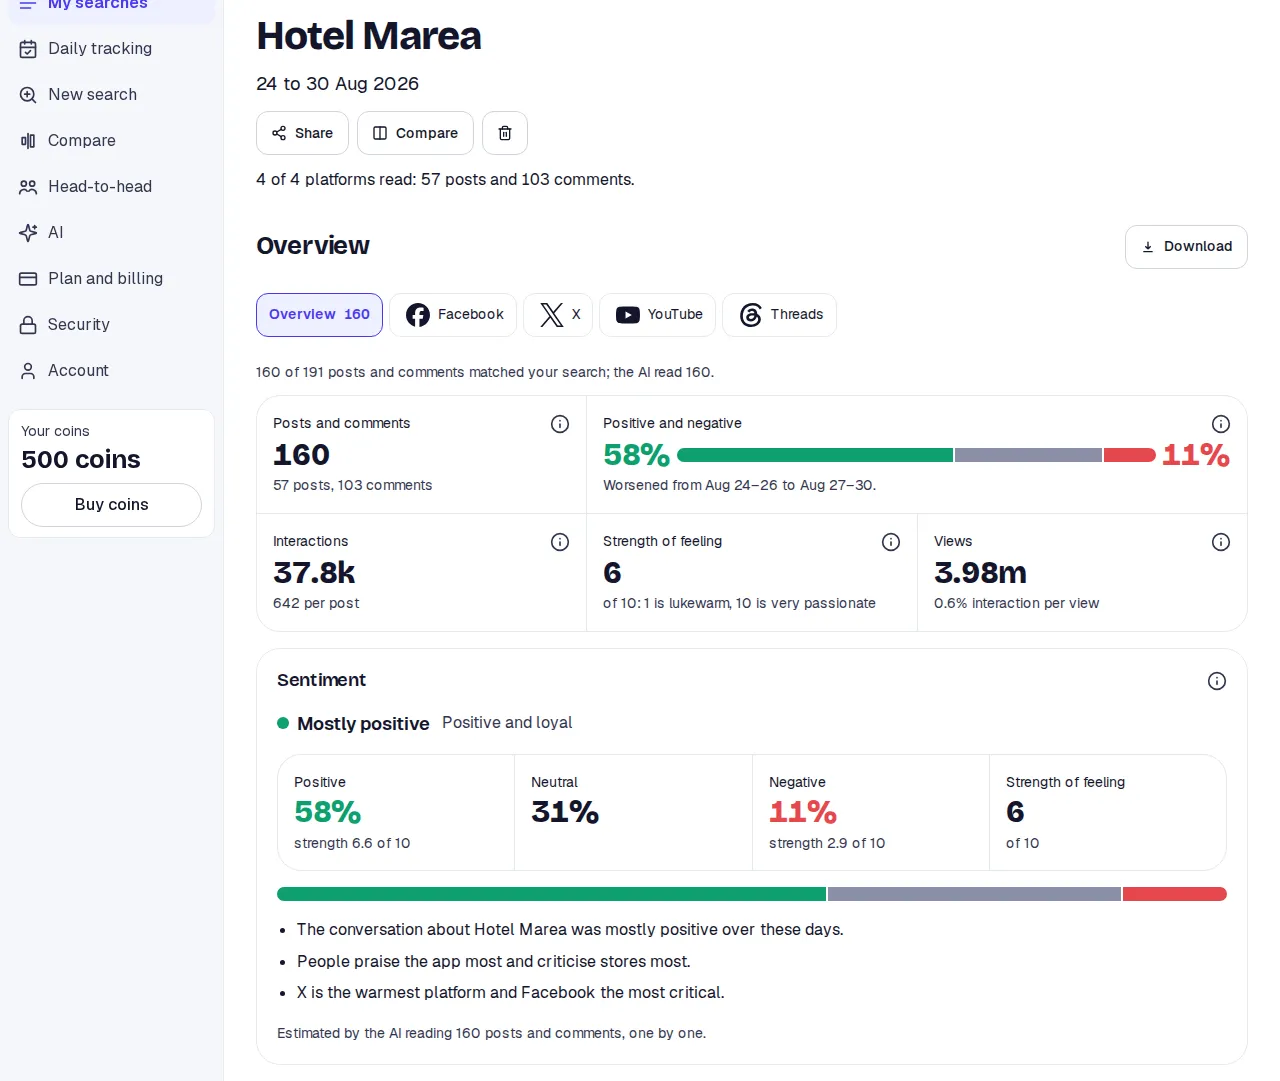
Section titled “The header”At the top are the topic, the dates and a line with how many platforms were read and the total of posts and comments. On the right, Download. Below, the Share, Compare and delete buttons.
The tabs
Section titled “The tabs”A row of tabs: Overview, with the total it counts, and one per platform. If they do not fit, arrows appear at the sides.
Inside a platform there are three views: Analysis, Posts and Comments. A platform’s analysis has the same shape as the Overview, but with its own data only.
The Overview cards
Section titled “The Overview cards”Sentiment
Section titled “Sentiment”The verdict in one line: Mostly positive, Mostly negative, Mostly neutral or Opinions divided. Divided means positive and negative are both above 30% and within 10 points of each other.
The figures:
- Posts and comments: how many talk about the topic in these dates, without duplicates. Below, how many posts and how many comments.
- Positive and negative: of every 100 read, how many were positive (green) and how many negative (red). Grey is neutral. Below, whether the second half of the dates came out better, worse or the same as the first.
- Interactions: likes, comments and shares added up. Below, the average per post.
- Strength of feeling: from 1 to 10. 1 is lukewarm, 10 is very passionate.
- Views: only from the platforms that show them. Below, out of every 100 views how many led to an interaction.
It closes with the reason for the verdict in two or three points and the note Estimated by the AI reading N posts and comments, one by one.
How to read it: positive means supportive or approving; neutral means factual with no stance; negative means critical, concerned or blaming. Posts that are not about the topic or fall outside your dates do not count.
Sentiment by platform
Section titled “Sentiment by platform”One row per platform with its verdict, its split and the reason in one line. The line above names the most negative and the least. A platform with fewer than 10 items read is marked little data.
Sentiment by theme
Section titled “Sentiment by theme”The themes of the conversation and each one’s split. That shows which subject carries the negative and which the positive. Each theme’s split is the AI’s estimate; mentions are the theme’s share of what was read.
Sentiment over time
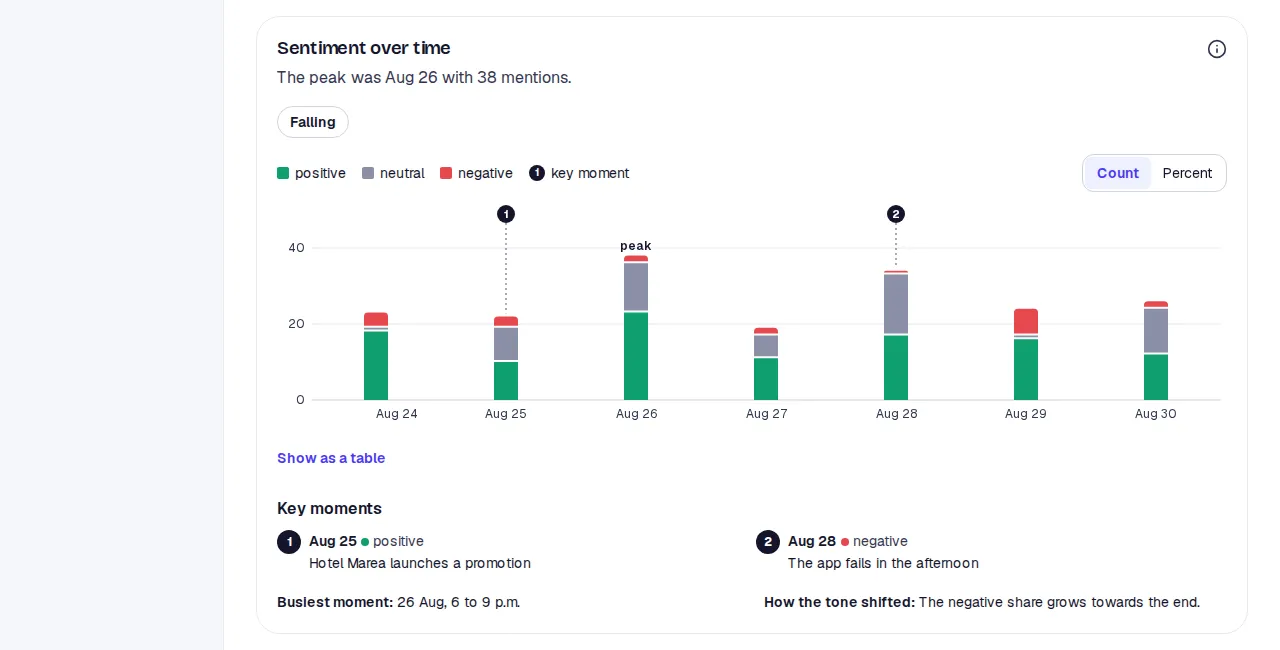
Section titled “Sentiment over time”One column per day: its height is that day’s posts and comments, and the colours how many were positive, neutral or negative. Switch between Count and Percent to compare days with different volume. The numbers above the columns mark the Key moments the AI found, explained below. It also gives the peak, whether the tone is Rising, Falling or Steady, and there is a table view.
Main complaints
Section titled “Main complaints”The complaints the AI found and the Themes driving the negative: those at least 30% negative, ordered by how much negative they carry.
Platform comparison
Section titled “Platform comparison”A tone score from −10 to +10 per platform and engagement from 1 to 10. Then, in words: the tone differences, what is unique to each platform, why it matters, where they disagree and what shows on several.
What to do
Section titled “What to do”Steps the AI suggests from what it read, each with its Why.
Posts to answer
Section titled “Posts to answer”Criticism worth a reply, most liked first, with its original text and link.
What got the most interaction
Section titled “What got the most interaction”The posts and comments with the most likes, in their words and with the link, and the Topics that move people.
Findings
Section titled “Findings”What the AI found while reading, each finding with the evidence behind it.
Public reaction
Section titled “Public reaction”In four parts: Tone, Who speaks, How they engage and Typical reactions.
Emotions
Section titled “Emotions”Eight emotions as a share of what was read: joy, trust, anticipation, surprise, sadness, fear, anger and disgust. All eight are listed, the absent ones too.
Repeated phrases
Section titled “Repeated phrases”Phrases that come up again and again, how often and in what sense. Below, the Growing topics.
More detail
Section titled “More detail”A folded card with measures that open one by one:
- Share of the conversation: what part of everything comes from each platform.
- Conversation depth: comments per post on each platform.
- When people talk: posts and comments by weekday and hour, in the search’s time zone. Darker means more activity.
- Repeat voices: what part of the comments the 10 most active authors wrote. Under 20% is organic talk; high can mean a few accounts.
- Languages: of the posts that record one.
- Accounts: the most active and the most engaging. Only on a platform’s tab.
- Hashtags and mentions: how many times each appears.
- How this search was read: how many were found, how many checked, how many were about the topic and how many the AI read, and where the plan or the reading limit stopped it.
Search details
Section titled “Search details”At the end of the Overview: the topic, the question, the dates, the platforms, when it was created and finished, and a table per platform with Found, Checked, Relevant and Read.
A platform with little
Section titled “A platform with little”If fewer than 10 posts and comments were read on a platform, its tab has no charts: a sentence says so and below it is What was found, with every text. If a platform could not be read, the tab says so.
The language
Section titled “The language”The report comes in the language you picked when searching. If you view the site in another language, a note says so; the cards are not translated, so their headings match the AI’s text.